If physics is innovates you, then this certainly has to be innovative too.........................................
Download official android app - http://www.appsgeyser.com/707739
Wednesday, January 15, 2014
White Dwarf
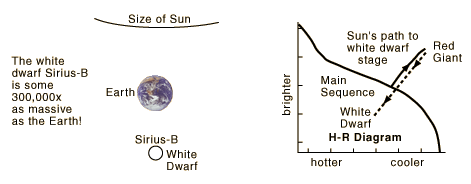
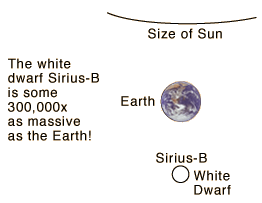
When the triple-alpha process in a red giant star is complete, those evolving from stars less than 4 solar masses do not have enough energy to ignite the carbon fusion process. They collapse, moving down and to the left of the main sequence until their collapse is halted by the pressure arising from electron degeneracy. An interesting example of a white dwarf is Sirius-B, shown in comparison with the Earth's size below. The sun is expected to follow the indicated pattern to the white dwarf stage. 1 teaspoon of a white dwarf would weigh 5 tons. A white dwarf with solar mass would be about the size of the Earth.
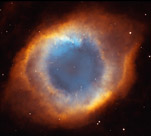
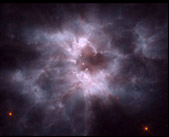
At left may be a future white dwarf in Helix Nebula. At right is hot white dwarf NGC2440. Both are surrounded by "cocoons" of the gas they ejected in their collapse toward the white dwarf stage.
Another probable future white dwarf can be seen in IC-5148 .
Sirius-B
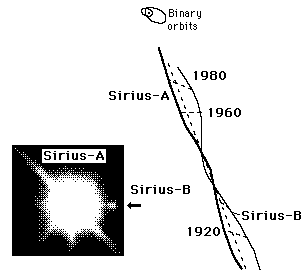
The white dwarf Sirius-B was not seen until 1862, but was predicted in 1844 from the motion of Sirius-A. The black-body spectrum of Sirius-B peaks at 110 nm, corresponding to a temperature of 26,000 K. From the known absolute magnitude, the radius is calculated to be just 4200 km. Smaller than the Earth, it is almost as massive as the Sun.
Electron Degeneracy
Electron degeneracy is a stellar application of the Pauli Exclusion Principle, as is neutron degeneracy. No two electrons can occupy identical states, even under the pressure of a collapsing star of several solar masses. For stellar masses less than about 1.44 solar masses, the energy from the gravitational collapse is not sufficient to produce the neutrons of a neutron star, so the collapse is halted by electron degeneracy to form white dwarfs. This maximum mass for a white dwarf is called the Chandrasekhar limit. As the star contracts, all the lowest electron energy levels are filled and the electrons are forced into higher and higher energy levels, filling the lowest unoccupied energy levels. This creates an effective pressure which prevents further gravitational collapse.
Sirius-B gives an example of the size of a white dwarf. Electron degeneracy halts the collapse of this star at the white dwarf stage. Though comparable in mass to the Sun, its white dwarf stage is smaller than the Earth.
Sirius-A
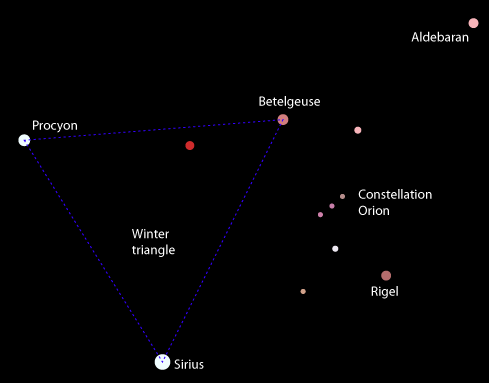
The star Sirius, referred to as Sirius-A, is perhaps most notable for the study of the "companion of Sirius" or Sirius-B which was the first example of a white dwarf star to be studied. Sirius itself is one of the brightest stars in the sky, being only 8.6 light-years away from us. It is also notable for being the subject of one of the first serious studies of the carbon cycle of nuclear fusion. It is much hotter than our Sun and it was clear that some process other than proton-proton fusion was taking place to produce all that energy.
The Chandrasekhar Limit for White Dwarfs
The calculation of the maximum mass of 1.44 solar masses for a white dwarf was done by Subrahmanyan Chandrasekhar on a ship on the way from India to England to begin graduate study in physics at Cambridge University! This initial calculation was done when he was only 20 and carefully refined by the time he was 22! The naming of the limit for its discoverer seems particularly appropriate in light of the intense personal story which surrounds it. Chandrasekhar was interested in the final states of collapsed stars as determined by electron degeneracy and had used the work of Arthur S. Eddington and Ralph H. Fowler to begin his calculations. He realized that they hadn't included relativity in their calculations. When he revised their equations to include relativity, he found that above a certain limit there was no solution. This implied that for masses above 1.44 solar masses there could be no balance between electron degeneracy and the crushing gravitational force and that the star would continue to collapse.
The poignancy of the situation for this young, essentially self-taught, physicist was that Eddington strongly resisted his ideas for years! Eddington's public and vocal opposition made Chandrasekhar's life so difficult that at age 29 he wrote a definitive book on the subject of stellar structure, determined to close that subject and pursue other interests. In the process, he produced a work which defined the subject for years afterward and is regarded as a classic.
To Eddington's credit, he later acknowledged the value and correctness of Chandrasekhar's work as he wrote about the remarkable white dwarf Sirius-B: "The message of the Companion of Sirius when it was decoded ran:'I am composed of material 3,000 times denser than anything you have come across; a ton of my material would be a little nugget that you could put in a matchbox.' What reply can one make to such a message? The reply that most of us made in 1914 was - 'Shut up. Don't talk nonsense.'"
Chandrasekhar himself had no idea what would happen when the limit of 1.44 solar masses was exceeded, except that the star would continue to collapse. Our present understanding is that the collapse will continue until it is stopped by neutron degeneracy with the formation of a neutron star. But even that is not the ultimate limit, since neutron degeneracy can also be overcome by masses greater than 3 solar masses and the ultimate collapse is toward a black hole.
Watch video:
Tuesday, January 14, 2014
Fundamental Forces
As you sit in front of your computer reading this article, you may be unaware of the many forces acting upon you. A force is defined as a push or pull that changes an object's state of motion or causes the object to deform. Newton defined a force as anything that caused an object to accelerate -- F = ma, where F is force, m is mass and a is acceleration.
The familiar force of gravity pulls you down into your seat, toward the Earth's center. You feel it as your weight. Why don't you fall through your seat? Well, another force, electromagnetism, holds the atoms of your seat together, preventing your atoms from intruding on those of your seat. Electromagnetic interactions in your computer monitor are also responsible for generating light that allows you to read the screen.
Gravity and electromagnetism are just two of the four fundamental forces of nature, specifically two that you can observe every day. What are the other two, and how do they affect you if you can't see them?
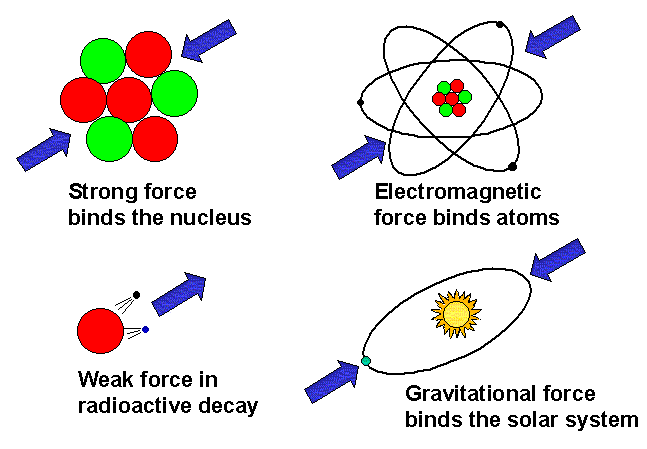
The remaining two forces work at the atomic level, which we never feel, despite being made of atoms. The strong force holds the nucleus together. Lastly, the weak force is responsible for radioactive decay, specifically, beta decay where a neutron within the nucleus changes into a proton and an electron, which is ejected from the nucleus.
Without these fundamental forces, you and all the other matter in the universe would fall apart and float away. Let's look at each fundamental force, what each does, how it was discovered and how it relates to the others.
Gravity
The first force that you ever became aware of was probably gravity. As a toddler, you had to learn to rise up against it and walk. When you stumbled, you immediately felt gravity bring you back down to the floor. Besides giving toddlers trouble, gravity holds the moon, planets,sun, stars and galaxies together in the universe in their respective orbits. It can work over immense distances and has an infinite range.
Isaac Newton envisioned gravity as a pull between any two objects that was directly related to their masses and inversely related to the square of the distance separating them. His law of gravitation enabled mankind to send astronauts to the moon and robotic probes to the outer reaches of our solar system. From 1687 until the early 20th century, Newton's idea of gravity as a "tug-of-war" between any two objects dominated physics.
But one phenomenon that Newton's theories couldn't explain was the peculiar orbit of Mercury. The orbit itself appeared to rotate (also known as precession). This observation frustrated astronomers since the mid-1800s. In 1915, Albert Einstein realized that Newton's laws of motion and gravity didn't apply to objects in high gravity or at high speeds, like the speed of light.
In his general theory of relativity, Albert Einstein envisioned gravity as a distortion of space caused by mass. Imagine that you place a bowling ball in the middle of a rubber sheet. The ball makes a depression in the sheet (a gravity well or gravity field). If you roll a marble toward the ball, it will fall into the depression (be attracted to the ball) and may even circle the ball (orbit) before it hits. Depending upon the speed of the marble, it may escape the depression and pass the ball, but the depression might alter the marble's path. Gravity fields around massive objects like the sun do the same. Einstein derived Newton's law of gravity from his own theory of relativity and showed that Newton's ideas were a special case of relativity, specifically one applying to weak gravity and low speeds.
When considering massive objects (Earth, stars, galaxies), gravity appears to be the most powerful force. However, when you apply gravity to the atomic level, it has little effect because the masses of subatomic particles are so small. On this level, it's actually downgraded to the weakest force.
Electromagnetism
If you brush your hair several times, your hair may stand on end and be attracted to the brush. Why? The movement of the brush imparts electrical charges to each hair and the identically charged individual hairs repel each other. Similarly, if you place identical poles of two bar magnets together, they will repel each other. But set the opposite poles of the magnets near one another, and the magnets will attract each other. These are familiar examples of electromagnetic force; opposite charges attract, while like charges repel.
Scientists have studied electromagnetism since the 18th century, with several making notable contributions.
In 1785, famed French physicist Charles Coulomb described the force of electrically charged objects as directly proportional to the magnitudes of the charges and inversely related to the square of the distances between them. Like gravity, electromagnetism has an infinite range.
In 1819, Danish physicist Hans Christian Oersted discovered that electricity and magnetism were very much related, leading him to declare that an electric current generates a magnetic force.
British-born physicist and chemist Michael Faraday weighed in on electromagnetism, showing that magnetism could be used to generate electricity in 1839.
In the 1860s, James Clerk Maxwell, the Scottish math and physics whiz, derived equations that described how electricity and magnetism were related.
Finally, Dutchman Hendrik Lorentz calculated the force acting on a charged particle in an electromagnetic field in 1892.
When scientists worked out the structure of the atom in the early 20th century, they learned that subatomic particles exerted electromagnetic forces on each other. For example, positively charged protons could hold negatively charged electrons in orbit around the nucleus. Furthermore, electrons of one atom attracted protons of neighboring atoms to form a residual electromagnetic force, which prevents you from falling through your chair.
But how does electromagnetism work at an infinite range in the large world and a short range at the atomic level? Physicists thought that photons transmitted electromagnetic force over large distances. But they had to devise theories to reconcile electromagnetism at the atomic level, and this led to the field of quantum electrodynamics (QED). According to QED, photons transmit electromagnetic force both macroscopically and microscopically; however, subatomic particles constantly exchange virtual photons during their electromagnetic interactions.
But electromagnetism can't explain how the nucleus holds together. That's where nuclear forces come into play.
Nuclear Forces
The nucleus of any atom is made of positively charged protons and neutral neutrons. Electromagnetism tells us that protons should repel each other and the nucleus should fly apart. We also know that gravity doesn't play a role on a subatomic scale, so some other force must exist within the nucleus that is stronger than gravity and electromagnetism. In addition, since we don't perceive this force every day as we do with gravity and electromagnetism, then it must operate over very short distances, say, on the scale of the atom.
The force holding the nucleus together is called the strong force, alternately called the strong nuclear force or strong nuclear interaction. In 1935, Hideki Yukawa modeled this force and proposed that protons interacting with each other and with neutrons exchanged a particle called a meson -- later called a pion -- to transmit the strong force.
In the 1950s, physicists built particle accelerators to explore the structure of the nucleus. When they crashed atoms together at high speeds, they found the pions predicted by Yukawa. They also found that protons and neutrons were made of smaller particles called quarks. So, the strong force held the quarks together, which in turn held the nucleus together.
One other nuclear phenomenon had to be explained: radioactive decay. In beta emission, a neutron decays into a proton, anti-neutrino and electron (beta particle). The electron and anti-neutrino are ejected from the nucleus. The force responsible for this decay and emission must be different and weaker than the strong force, thus it's unfortunate name -- the weak force or the weak nuclear force or weak nuclear interaction.
With the discovery of quarks, the weak force was shown to be responsible for changing one type of quark into another through the exchange of particles called W and Z bosons, which were discovered in 1983. Ultimately, the weak force makes nuclear fusion in the sun and stars possible because it allows the hydrogen isotope deuterium to form and fuse.
Now that you can name the four forces -- gravity, electromagnetism, the weak force and the strong force -- we'll see how they compare and interact with one another.
Comparing the Fundamental Forces
From the fields of QED and quantum chromodynamics, or QCD, the field of physics that describes the interactions between subatomic particles and nuclear forces, we see that many of the forces are transmitted by objects exchanging particles called gauge particles or gauge bosons. These objects can be quarks, protons, electrons, atoms, magnets or even planets. So, how does exchanging particles transmit a force? Consider two ice skaters standing at some distance apart. If one skater throws a ball to the other, the skaters will move farther away from each other. Forces work in a similar way.
Physicists have isolated the gauge particles for most of the forces. The strong force uses pions and another particle called a gluon. The weak force uses W and Z bosons. The electromagnetic force uses photons. Gravity is thought to be conveyed by a particle called a graviton; however, gravitons haven't been found yet. Some of the gauge particles associated with the nuclear forces have mass, while others don't (electromagnetism, gravity). Because electromagnetic force and gravity can operate over huge distances like light-years, their gauge particles must be able to travel at the speed of light, perhaps even faster for gravitons. Physicists don't know how gravity is transmitted. But according to Einstein's theory of special relativity, no object with mass can travel at the speed of light, so it makes sense that photons and gravitons are mass-less gauge particles. In fact, physicists have firmly established that photons have no mass.
Which force is the mightiest of them all? That would be the strong nuclear force. However, it acts only over a short range, approximately the size of a nucleus. The weak nuclear force is one-millionth as strong as the strong nuclear force and has an even shorter range, less than a proton's diameter. The electromagnetic force is about 0.7 percent as strong as the strong nuclear force, but has an infinite range because photons carrying the electromagnetic force travel at the speed of light. Finally, gravity is the weakest force at about 6 x 10-29 times that of the strong nuclear force. Gravity, however, has an infinite range.
Physicists are currently pursuing the ideas that the four fundamental forces may be related and that they sprang from one force early in the universe. The idea isn't unprecedented. We once thought of electricity and magnetism as separate entities, but the work of Oersted, Faraday, Maxwell and others showed that they were related. Theories that relate the fundamental forces and subatomic particles are called fittingly grand unified theories. More on them next.
Uniting the Fundamental Forces
Science never rests, so the work on fundamental forces is far from finished. The next challenge is to construct one grand unified theory of the four forces, an especially difficult task since scientists have struggled to reconcile theories of gravity with those of quantum mechanics.
That's where particle accelerators, which can induce collisions at higher energies, come in handy. In 1963, physicists Sheldon Glashow, Abdul Salam and Steve Weinberg suggested that the weak nuclear force and electromagnetic force might combine at higher energies in what would be called the electroweak force. They predicted that this would occur at an energy of about 100 giga-electron volts (100GeV) or a temperature of 1015 K, which occurred shortly after the Big Bang. In 1983, physicists reached these temperatures in a particle accelerator and showed that the electromagnetic force and weak nuclear force were related.
Theories predict that the strong force will unite with the electroweak force at energies above 1015 GeV and that all the forces may unite at energies above 1019 GeV. These energies approach the temperature at the earliest portion of the Big Bang. Physicists are striving to build particle accelerators that might reach these temperatures. The largest particle accelerator is the Large Hadron Collider at CERN in Geneva, Switzerland. When it comes online, it will be capable of accelerating protons to 99.99 percent the speed of light and reaching collision energies of 14 tera-electron volts or 14 TeV, which is equal to 14,000 GeV or 1.4 x 10⁴GeV.
If physicists can show that the four fundamental forces indeed came from one unified force when the universe cooled from the Big Bang, will that change your daily life? Probably not. However, it will advance our understanding of the nature of forces, as well as the origins and fate of the universe.
Watch videos:
Monday, January 13, 2014
Scattering Of Light
Blue Sky
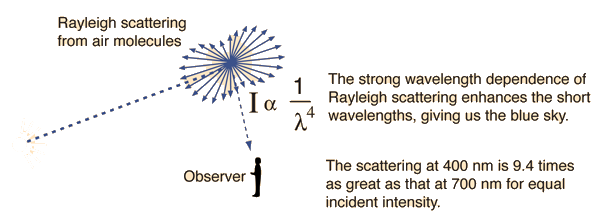
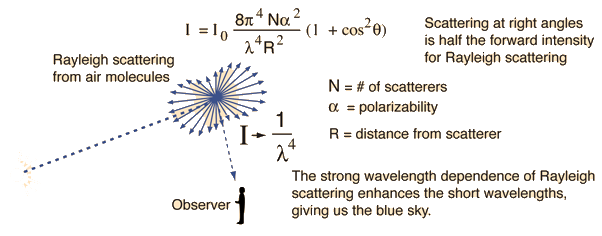
The blue color of the sky is caused by the scattering of sunlight off the molecules of the atmosphere. This scattering, called Rayleigh scattering, is more effective at short wavelengths (the blue end of the visible spectrum). Therefore the light scattered down to the earth at a large angle with respect to the direction of the sun's light is predominantly in the blue end of the spectrum.
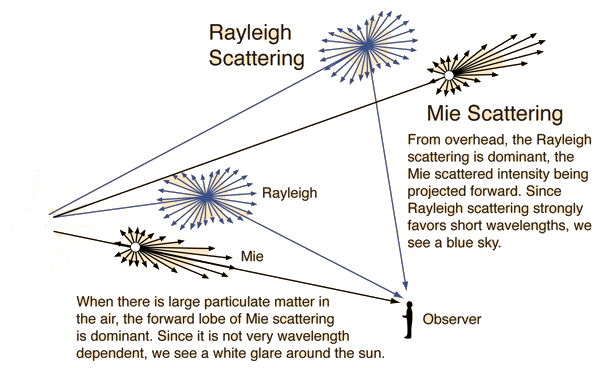
Note that the blue of the sky is more saturated when you look further from the sun. The almost white scattering near the sun can be attributed to Mie scattering, which is not very wavelength dependent.
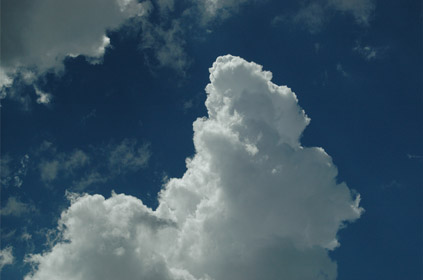
Clouds in contrast to the blue sky appear white to achromatic gray.
The water droplets that make up the cloud are much larger than the molecules of the air and the scattering from them is almost independent of wavelength in the visible range.
Rayleigh Scattering
Rayleigh scattering refers to the scattering of light off of the molecules of the air, and can be extended to scattering from particles up to about a tenth of the wavelength of the light. It is Rayleigh scattering off the molecules of the air which gives us the blue sky. Lord Rayleigh calculated the scattered intensity from dipole scatters much smaller than the wavelength to be:
Rayleigh scattering can be considered to be elastic scattering since the photon energies of the scattered photons is not changed. Scattering in which the scattered photons have either a higher or lower photon energy is called Raman scattering. Usually this kind of scattering involves exciting some vibrational mode of the molecules, giving a lower scattered photon energy, or scattering off an excited vibrational state of a molecule which adds its vibrational energy to the incident photon.
Mie Scattering
The scattering from molecules and very tiny particles (< 1 /10 wavelength) is predominantly Rayleigh scattering. For particle sizes larger than a wavelength, Mie scattering predominates. This scattering produces a pattern like an antenna lobe, with a sharper and more intense forward lobe for larger particles.
Mie scattering is not strongly wavelength dependent and produces the almost white glare around the sun when a lot of particulate material is present in the air. It also gives us the the white light from mist and fog. Greenler in his "Rainbows, Haloes and Glories" has some excellent color plates demonstrating Mie scattering and its dramatic absence in the particle-free air of the polar regions. Comparing Rayleigh Scattering with Mie Scattering Raman Scattering
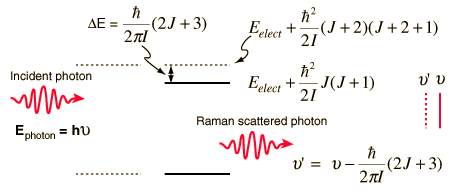
When light encounters molecules in the air, the predominant mode of scattering is elastic scattering, called Rayleigh scattering. This scattering is responsible for the blue color of the sky; it increases with the fourth power of the frequency and is more effective at short wavelengths. It is also possible for the incident photons to interact with the molecules in such a way that energy is either gained or lost so that the scattered photons are shifted in frequency. Such inelastic scattering is called Raman scattering. Like Rayleigh scattering, the Raman scattering depends upon the polarizability of the molecules. For polarizable molecules, the incident photon energy can excite vibrational modes of the molecules, yielding scattered photons which are diminished in energy by the amount of the vibrational transition energies. A spectral analysis of the scattered light under these circumstances will reveal spectral satellite lines below the Rayleigh scattering peak at the incident frequency. Such lines are called "Stokes lines". If there is significant excitation of vibrational excited states of the scattering molecules, then it is also possible to observe scattering at frequencies above the incident frequency as the vibrational energy is added to the incident photon energy. These lines, generally weaker, are called anti-Stokes lines. Although finding some application in vibrational spectroscopy of molecules, the use of direct infrared sources for such spectroscopy is usually much easier. Raman spectroscopy has found some application in remote monitoring for pollutants. For example, the scattering produced by a laser beam directed on the plume from an industrial smokestack can be used to monitor the effluent for levels of molecules which will produce recognizable Raman lines. Raman scattering can also involve rotational transitions of the molecules from which the scattering occurs. Thornton and Rex picture a photon of energy slightly than the energy separation of two levels being scattered, with the excess energy released in the form of a photon of lower energy. Since this is a two-photon process, the selection rule is DJ = +/-2 for rotational Raman transitions. The sketch below is an idealized depiction of a Raman line produced by interaction of a photon with a diatomic molecule for which the rotational energy levels depend upon one moment of inertia. The upper electronic state of such a molecule can have different levels of rotational and vibrational energy. In this case the upper state is shown as being in rotational state J with scattering associated with an incoming photon at energy matching the J+2 state.
Since the Raman effect depends upon the polarizability of the molecule, it can be observed for molecules which have no net dipole moment and therefore produce no pure rotational spectrum. This process can yield information about the moment of inertia and hence the structure of the molecule. In Raman scattering, an intense monochromatic light source (laser) can give scattered light which includes one or more "side-bands" that are offset by rotational and/or vibrational energy differences. This is potentially very useful for remote sensing, since the side-band frequencies contain information about the scattering medium which could be useful for identification. Current projects envision Raman scattering as a tool for identification of mineral forms on Mars. Such remote sensing could become a major tool in planetary exploration. Raman Scattering On Minerals Raman scattering can be used as a tool for the identification of minerals. Since the Raman spectra for different mineral tend to have sharp peaks which form a fairly unique pattern, they can serve as "fingerprints" for minerals. Since the Raman spectra can be collected remotely, they show great promise for planetary exploration.
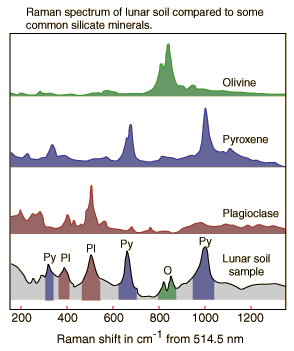
The illustration at left shows qualitative sketches of Raman spectra displayed by the Department of Earth and Planetary Sciences, Washington University in St. Louis. This research group is developing Raman spectrometers for in situ analysis of minerals on planetary surfaces. The spectra are attributed to Wang et al., J. Geophys. Res. 100, p21189-21199 (1995). Spectra of the common silicate minerals olivine, pyroxene, and plagioclase are compared to a Raman spectrum of a lunar soil sample identified as 71501.
Watch Video:
Sunday, January 12, 2014
The Law of Reflection
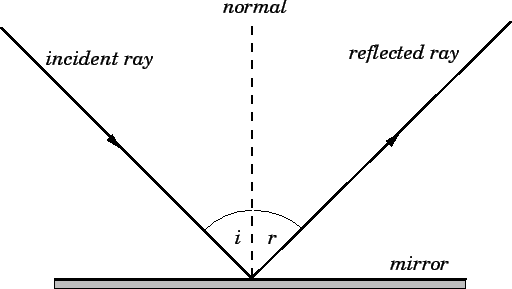
Light is known to behave in a very predictable manner. If a ray of light could be observed approaching and reflecting off of a flat mirror, then the behavior of the light as it reflects would follow a predictable law known as the law of reflection. The diagram below illustrates the law of reflection.
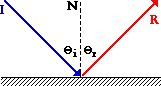
In the diagram, the ray of light approaching the mirror is known as the incident ray (labeled I in the diagram). The ray of light that leaves the mirror is known as the reflected ray (labeled R in the diagram). At the point of incidence where the ray strikes the mirror, a line can be drawn perpendicular to the surface of the mirror. This line is known as a normal line(labeled N in the diagram). The normal line divides the angle between the incident ray and the reflected ray into two equal angles. The angle between the incident ray and the normal is known as the angle of incidence. The angle between the reflected ray and the normal is known as the angle of reflection. (These two angles are labeled with the Greek letter "theta" accompanied by a subscript; read as "theta-i" for angle of incidence and "theta-r" for angle of reflection.) The law of reflection states that when a ray of light reflects off a surface, the angle of incidence is equal to the angle of reflection.
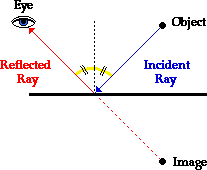
It is common to observe this law at work in a Physics lab such as the one described in the previous part of Lesson 1. To view an image of a pencil in a mirror, you must sight along a line at the image location. As you sight at the image, light travels to your eye along the path shown in the diagram below. The diagram shows that the light reflects off the mirror in such a manner that the angle of incidence is equal to the angle of reflection.
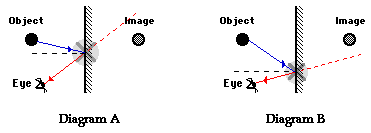
It just so happens that the light that travels along the line of sight to your eye follows the law of reflection. If you were to sight along a line at a different location than the image location, it would be impossible for a ray of light to come from the object, reflect off the mirror according to the law of reflection, and subsequently travel to your eye. Only when you sight at the image, does light from the object reflect off the mirror in accordance with the law of reflection and travel to your eye. This truth is depicted in the diagram below.
For example, in Diagram A above, the eye is sighting along a line at a position above the actual image location. For light from the object to reflect off the mirror and travel to the eye, the light would have to reflect in such a way that the angle of incidence is less than the angle of reflection. In Diagram B above, the eye is sighting along a line at a position below the actual image location. In this case, for light from the object to reflect off the mirror and travel to the eye, the light would have to reflect in such a way that the angle of incidence is more than the angle of reflection. Neither of these cases would follow the law of reflection. In fact, in each case, the image is not seen when sighting along the indicated line of sight. It is because of the law of reflection that an eye must sight at the image location in order to see the image of an object in a mirror.
Watch video:
Spectroscopy
Spectroscopy is the study of the interaction between matter and radiated energy. Historically, spectroscopy originated through the study of visible light dispersed according to its wavelength, e.g., by a prism. Later the concept was expanded greatly to comprise any interaction with radiative energy as a function of its wavelength or frequency. Spectroscopic data is often represented by a spectrum, a plot of the response of interest as a function of wavelength or frequency.The Nature of Light
To understand the processes in astronomy that generate light, we must realize first that light acts like a wave. Light has particle-like properties too, so it's actually quite a twisted beast (which is why it took so many years to figure out). But right now, let's just explore light as a wave.
Picture yourself wading around on an ocean beach for a moment, and watch the many water waves sweeping past you. Waves are disturbances, ripples on the water, and they possess a certain height (amplitude), with a certain number of waves rushing past you every minute (the frequency) and all moving at a characteristic speed across the water (the wave speed). Notice the distance between successive waves? That's called the wavelength.
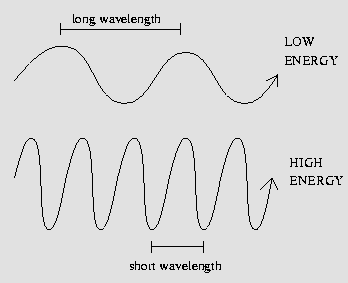
Keeping this analogy in mind, let's leave the ocean beach for a while and think about light like a wave. The wave speed of a light wave is simply the speed of light, and different wavelengths of light manifest themselves as different colors! The energy of a light wave is inversely-proportional to its wavelength; in other words,low-energy waves have long wavelengths, and high-energy light waves have short wavelengths.
The Electromagnetic Spectrum
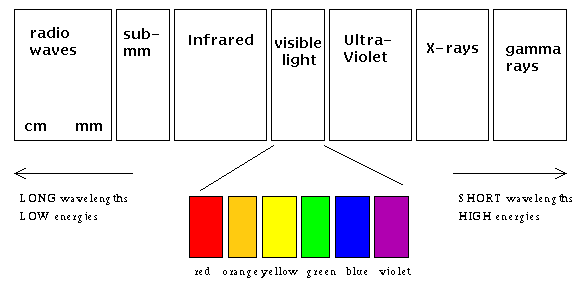
Physicists classify light waves by their energies (wavelengths). Labeled in increasing energy, we might draw the entire electromagnetic spectrum as shown in the figure below:
The Electromagnetic Spectrum. Notice how small the visible region of the spectrum is, compared to the entire range of wavelengths.
Notice that radio, TV, and microwave signals are all light waves, they simply lie at wavelengths (energies) that your eye doesn't respond to. On the other end of the scale, beware the high energy UV, x-ray, and gamma-ray photons! Each one carries a lot of energy compared to their visible- and radio-wave brethren. They're the reasons you should wear sunblock, for example.
When we look at the Universe in a different "light", i.e. at "non-visible" wavelengths, we probe different kinds of physical conditions -- and we can see new kinds of objects!For example, high-energy gamma-ray and X-ray telescopes tend to see the most energetic dynamos in the cosmos, such as active galaxies, the remnants from massive dying stars, accretion of matter around black holes, and so forth. Visible light telescopes best probe light produced by stars. Longer-wavelength telescopes best probe dark, cool, obscured structures in the Universe: dusty star-forming regions, dark cold molecular clouds, the primordial radiation emitted by the formation of the Universe shortly after the Big Bang. Only through studying astronomical objects at many different wavelengths are astronomers able to piece together a coherent, comprehensive picture of how the Universe works!
General Types of Spectra
Typically one can observe two distinctive classes of spectra: continuous and discrete. For a continuous spectrum, the light is composed of a wide, continuous range of colors (energies). With discrete spectra, one sees only bright or dark lines at very distinct and sharply-defined colors (energies). As we'll discover shortly, discrete spectra with bright lines are called emission spectra, those with dark lines are termed absorption spectra.
Continuous Spectra
Continuous spectra arise from dense gases or solid objects which radiate their heat away through the production of light. Such objects emit light over a broad range of wavelengths, thus the apparent spectrum seems smooth and continuous. Stars emit light in a predominantly (but not completely!) continuous spectrum. Other examples of such objects are incandescent light bulbs, electric cooking stove burners, flames, cooling fire embers and... you. Yes, you, right this minute, are emitting a continuous spectrum -- but the light waves you're emitting are not visible -- they lie at infrared wavelengths (i.e. lower energies, and longer wavelengths than even red light). If you had infrared-sensitive eyes, you could see people by the continuous radiation they emit!
Discrete Spectra
Discrete spectra are the observable result of the physics of atoms. There are two types of discrete spectra, emission (bright line spectra) and absorption (dark line spectra). Let's try to understand where these two types of discrete spectra.
Emission Line Spectra
Unlike a continuous spectrum source, which can have any energy it wants (all you have to do is change the temperature), the electron clouds surrounding the nuclei of atoms can have only very specific energies dictated by quantum mechanics. Each element on the periodic table has its own set of possible energy levels, and with few exceptions the levels are distinct and identifiable.
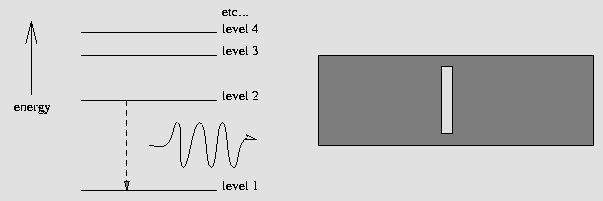
Atoms will also tend to settle to the lowest energy level (in spectroscopist's lingo, this is called the ground state). This means that an excited atom in a higher energy level must `dump' some energy. The way an atom `dumps' that energy is by emitting a wave of light with that exact energy.
In the diagram below, a hydrogen atom drops from the 2nd energy level to the 1st, giving off a wave of light with an energy equal to the difference of energy between levels 2 and 1. This energy corresponds to a specific color, or wavelength of light -- and thus we see a bright line at that exact wavelength! ...an emission spectrum is born, as shown below:
An excited Hydrogen atom relaxes from level 2 to level 1, yielding a photon. This results in a bright emission line.
Tiny changes of energy in an atom generate photons with small energies and long wavelengths, such as radio waves! Similarly, large changes of energy in an atom will mean that high-energy, short-wavelength photons (UV, x-ray, gamma-rays) are emitted.
Absorption Line Spectra
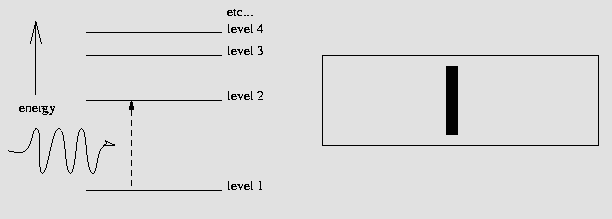
On the other hand, what would happen if we tried to reverse this process? That is, what would happen if we fired this special photon back into a ground state atom? That's right, the atom could absorb that `specially-energetic' photon and would become excited, jumping from the ground state to a higher energy level. If a star with a `continuous' spectrum is shining upon an atom, the wavelengths corresponding to possible energy transitions within that atom will be absorbed and therefore an observer will not see them. In this way, a dark-line absorption spectrum is born, as shown below:
A hydrogen atom in the ground state is excited by a photon of exactly the `right' energy needed to send it to level 2, absorbing the photon in the process. This results in a dark absorption line.
How does a spectrometer work?
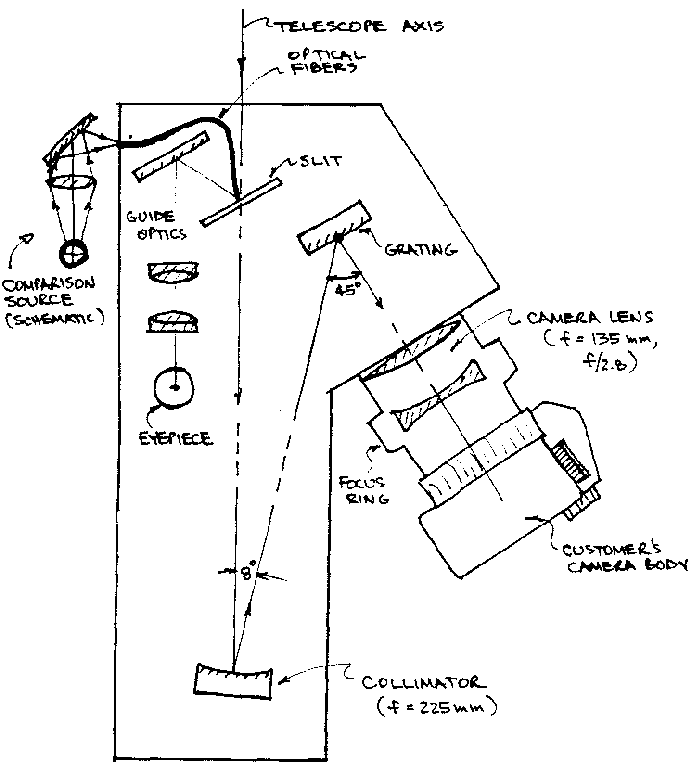
Many people know how a telescope works, but relatively few have much experience with the innards of a spectrometer. So let's take apart the Astronomy Camp spectrometer to see how it works! Keep in mind that there are as many optical designs for spectrometers as there are optical designs for telescopes, and that this is but one example. Nevertheless, it points out the salient features of most optical spectrometers.
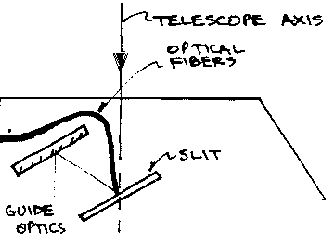
It all starts with the telescope light beam entering the spectrometer. The focal point of the telescope beam is brought to the slit of the spectrometer. This slit is what is ultimately imaged on the detector. In the case of the Camp spectrometer, the slit is arranged at an angle and the slit surroundings are silvered so that the portion of the telescope beam not passing through the slit can be routed instead to an eyepiece for easy telescope guiding.
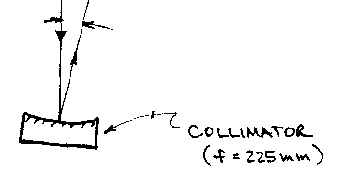
The light passing through the slit then is reflected off a collimating mirror, which parallelizes the beam of light, before sending it off...
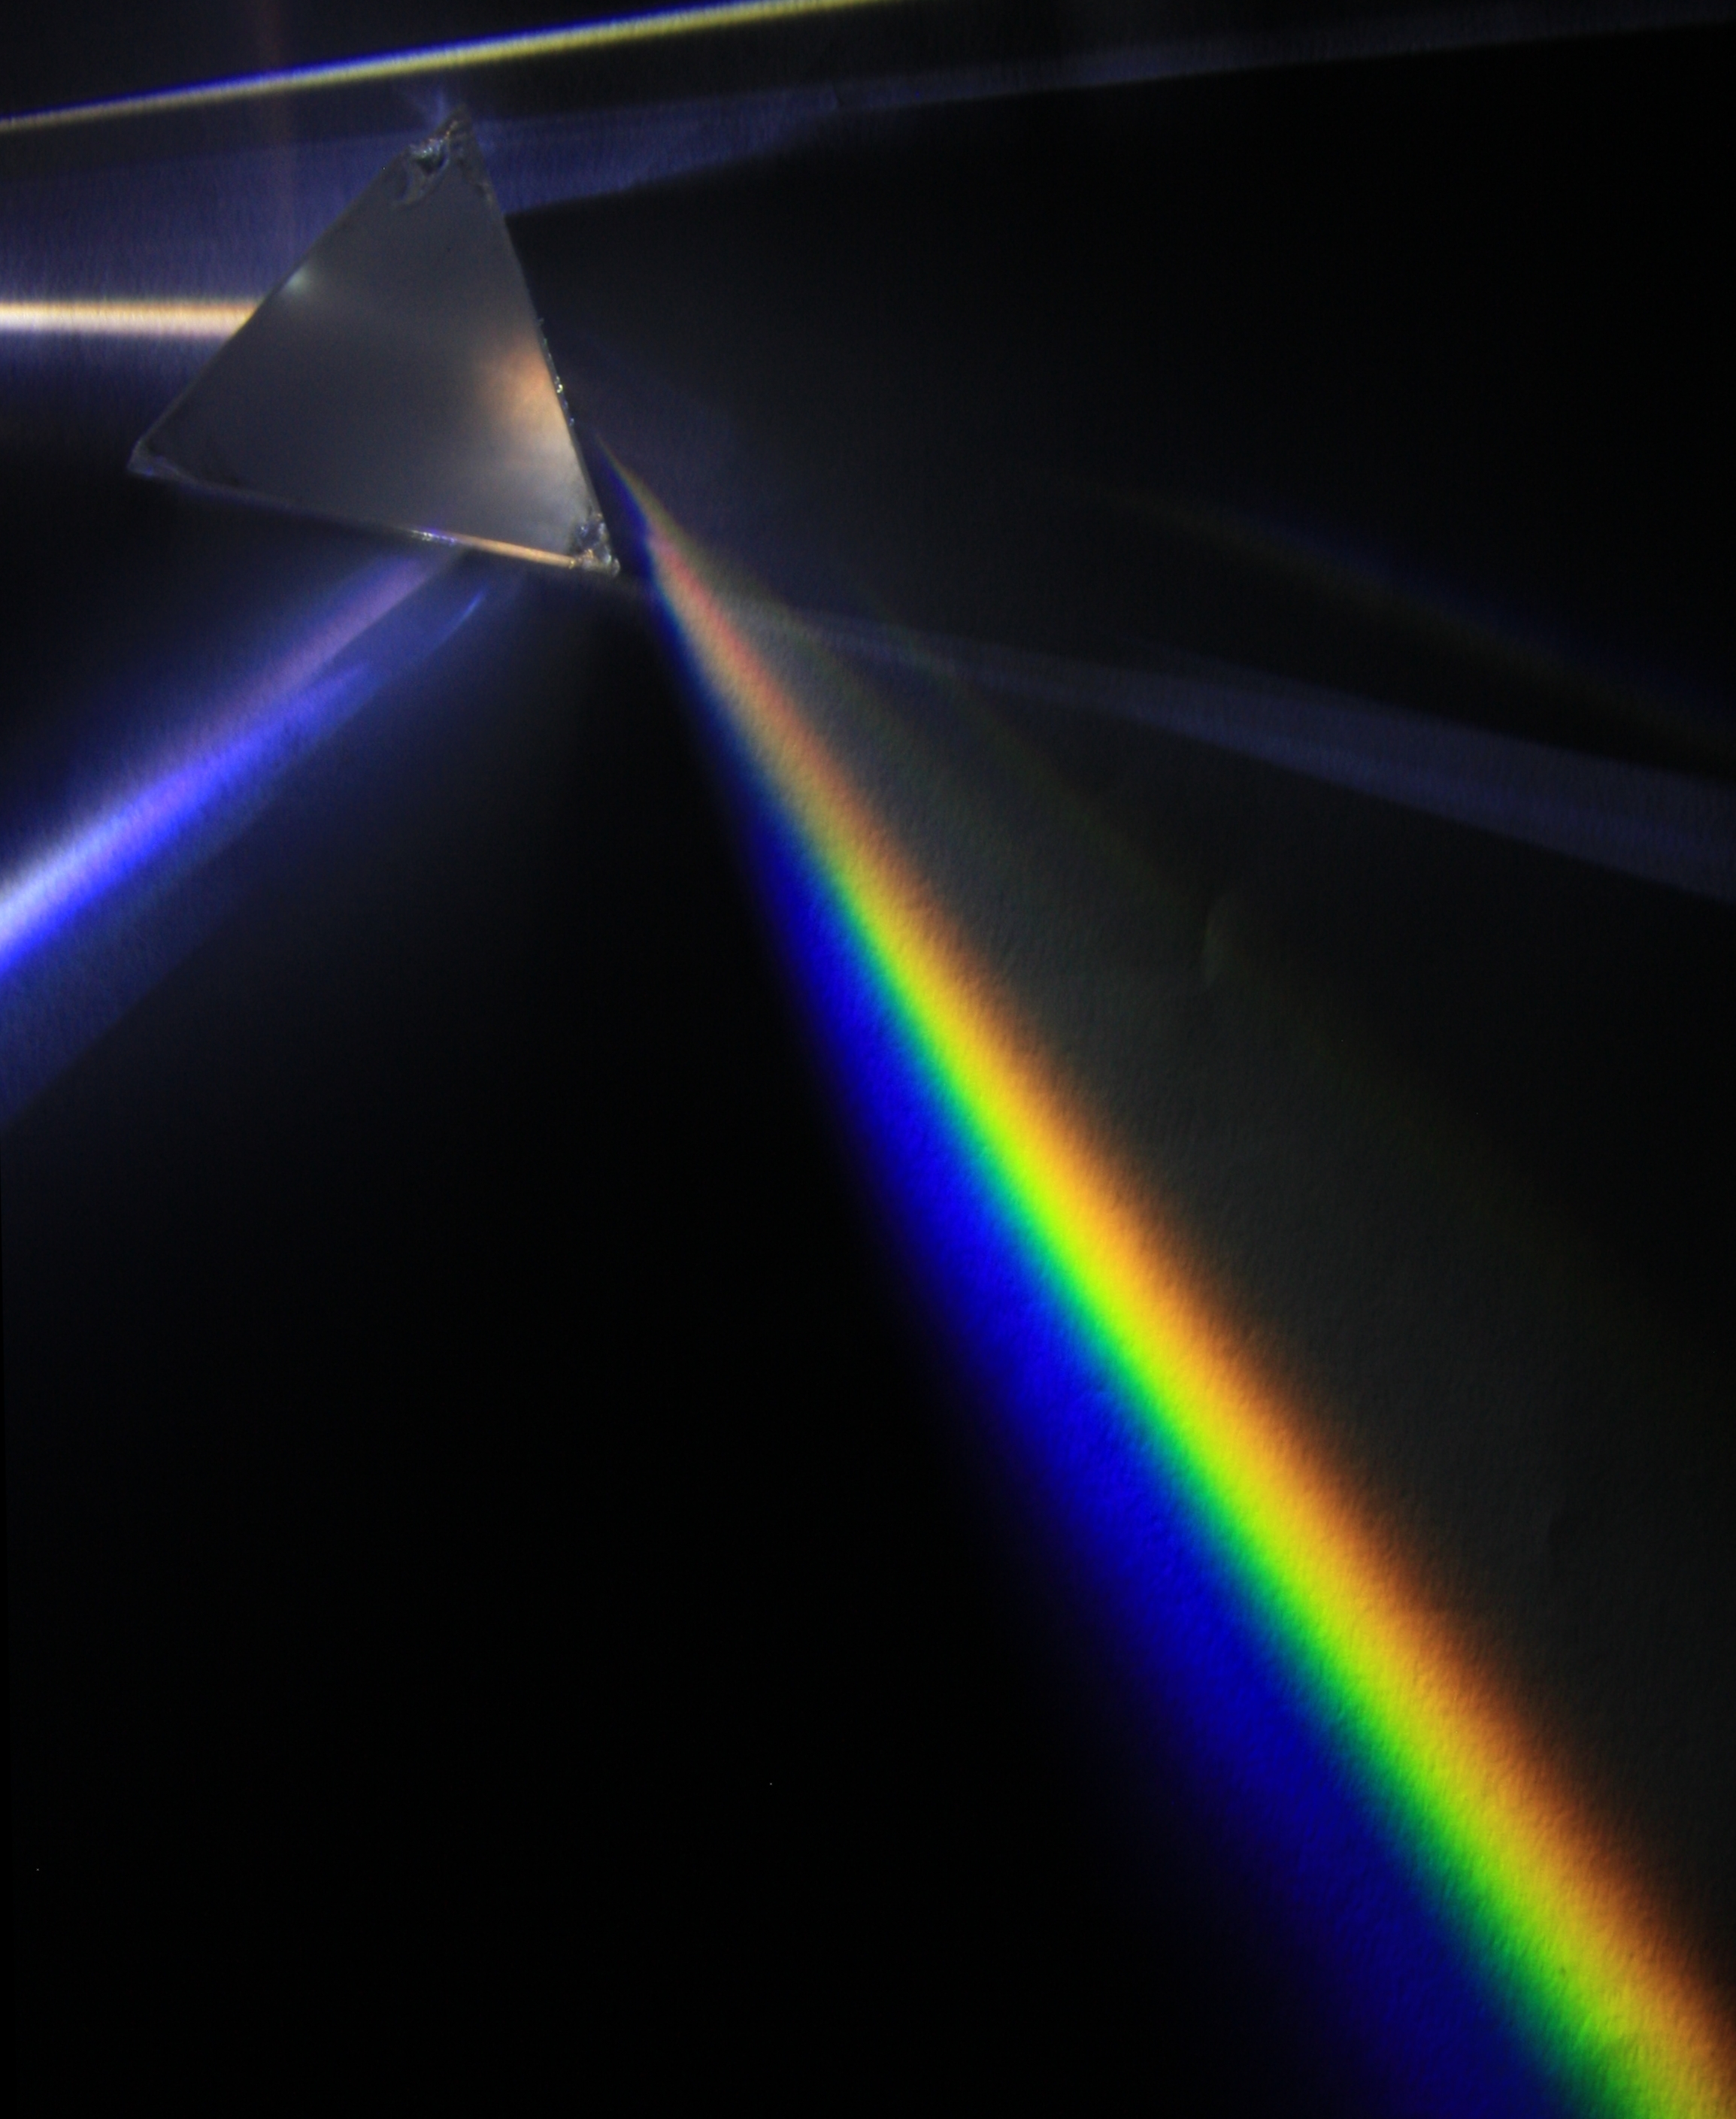
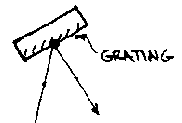
... to the diffraction grating! This optical element disperses the parallel beams of light into their component colors/wavelengths/energies. Each different wavelength comes off of the grating at a slightly different angle. So now, we have an image of the slit that is spread out like a rainbow by color.
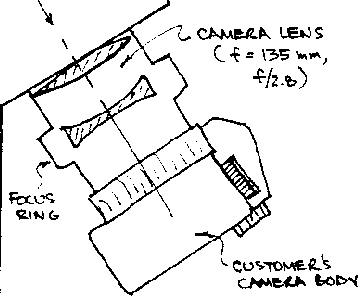
This new color-dispersed beam of light is then focused and imaged on the detector by the camera lens. A 35 mm camera is the detector in this diagram, but at Camp, we typically use an eyepiece or a CCD array.
So, now let's put all of this together to make a spectrometer! There is something interesting to note here -- in spectroscopy, we are not looking at ALL of the light from an object, just a certain "band" of wavelengths or colors. Furthermore, even that band is dispersed ("smeared out") over the entire detector. This means that the effective brightness, or surface brightness of an object on the detector is much lower than when simply taking images of an object. This means that it takes a bigger telescope and/or more integration time to get a good spectrum of a given object than an image.
The broader you disperse the light and the narrower you make the slit, the better your spectral resolution; you can see finer and more subtle features in the spectrum. However, there is a stiff price to pay: the emergent spectrum becomes much dimmer and more diffuse. High resolution spectroscopy therefore requires large telescopes and fairly bright objects. For very faint objects, some spectral resolution often must be compromised to even SEE the object.
Examples of Spectroscopy in Astronomy
Spectroscopy is a powerful tool in astronomy -- from it, we can often get information about the temperature, density, composition, and important physical processes of an astronomical object. This information can help us answer the questions:
What is it?
What is it like?
What is it made out of?
How did it get there? What will happen to it?
Does it give us clues as to how WE got here?
Molecular Spectroscopy and Comets
Comets consist of almost pristine material from the early formation of our solar system, unprocessed by harsh solar sunlight. Studying the chemistry of these "dirty snowballs" gives us a clue as to the composition and nature of our solar system in its infancy and constrains theories of how life may have formed on Earth.
Probing the Formation of Stars in Colliding Galaxies
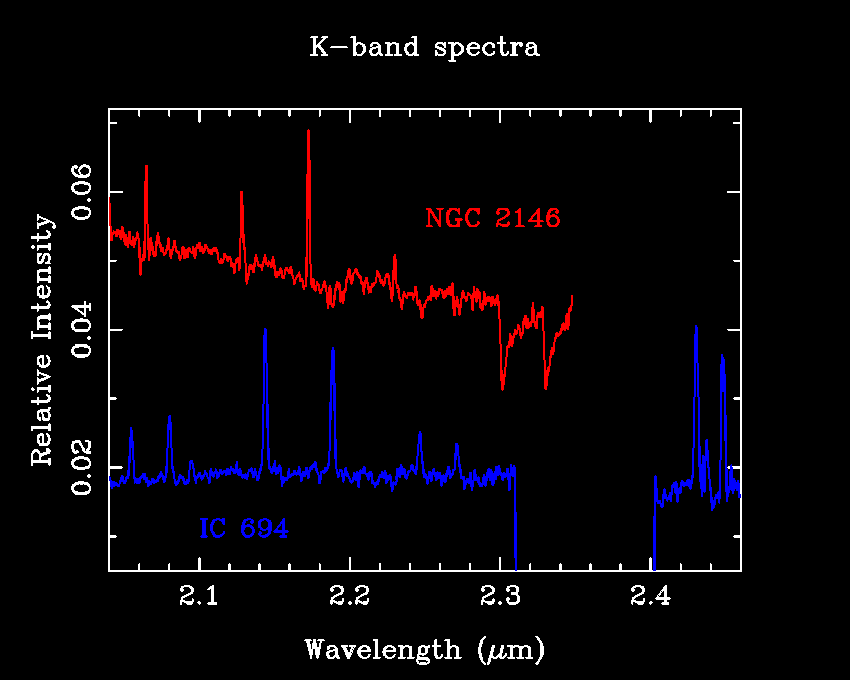
Billions of years ago, when our galaxy took form, it is thought that there must have been an epoch of rapid star-forming activity that has since subsided. We can get clues to how this may have looked by observing galaxies currently exhibiting violent, extreme star-formation. Such "star-burst" galaxies are studied best in the infrared and at radio wavelengths, since star-forming galaxies often harbor so much dust and gas that visible light cannot penetrate to the centers where the majority of the star formation is taking place. Below is an infrared (2.0 - 2.5 microns wavelength, or 20,000 - 25,000 Angstroms) spectrum of two such star-burst galaxies. Most of the features you see are from molecular hydrogen, H2, the stuff from which stars are made! These molecular hydrogen emission lines tell us that the molecular gas we see is very warm; in the top galaxy, the gas is excited by shock-heated gas. The bottom galaxy has molecular hydrogen excited by ultraviolet light emitted from recently-formed young, hot stars.
Uncovering the mystery of Quasars
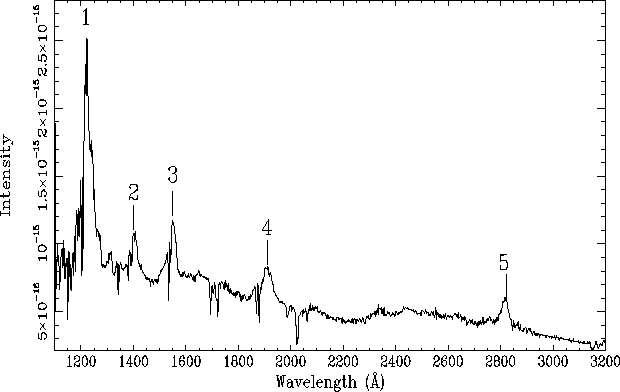
The distant nature of quasars were discovered in the early 1960's, when spectral lines were noted to be substantially-shifted redder than they should normally be. This red-shift can be attributed to the recession (speeding away) of quasars from us. In the standard Big Bang model of cosmology (the faster it's speeding away from you, the more distant it is), this rapid motion implies that quasars are the most distant objects known. Below is a typical spectrum of a quasar. The wavelength scale has been re-scaled to the "appropriate" rest wavelengths for the spectral lines. The most noticeable feature is the broad emission line at 1216 Angstroms due to hydrogen atoms making the transition from the first excited state to the ground state. Although 1216 Angstroms lies deep in the ultraviolet, where the Earth's atmosphere is opaque, many quasars are receding from us so fast, this line is red-shifted into the visible part of the spectrum (4000-7000 Angstroms).
Spectroscopy at Astronomy Camp!
Spectroscopy at Astronomy Camp is done with a spectrograph from Optomechanics Research Inc, coupled with the Mount Lemmon 40" or 60" telescopes and the Camp's SBIG ST6 CCD detector array. With relatively short exposure times, good quality spectra can be taken of most catalogued stars and high surface-brightness deep-sky objects. A few examples of Astronomy Campers' handiwork are shown below.
Planetary Nebulae, Or 'Why Light Pollution Filters Work'!
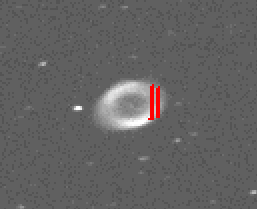
Here's an image of M57 (a.k.a. the Ring Nebula), with a crude representation of the spectrometer slit superimposed. This image is a 180 second exposure using the Camp's ST6 CCD on a 10" Meade Schmidt-Cassagrain telescope. Astronomy Camp's spectrograph was mounted on the Mount Lemmon 60" telescope with the same ST6 CCD. The slit length is about 8 arcminutes long and 1 arcsecond wide; the representation of the slit width in the diagram is exaggerated.
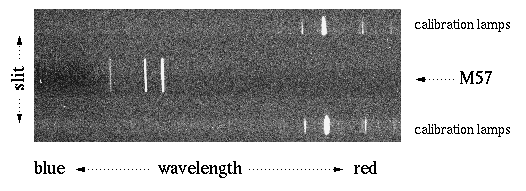
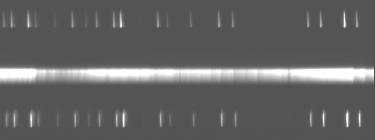
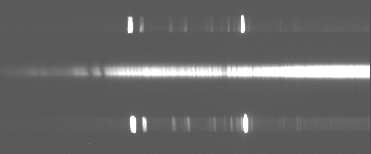
We combined four 5-minute exposures on the Ring Nebula using the 60" and the ST6 camera. We subtracted an appropriate 5 minute dark frame from each image and then combined the images using IRAF. The resulting ST6 image follows: the dispersion (wavelength) axis is horizontal, and the spatial axis (along the Ring Nebula) is vertical. The central lines are M57, the upper and lower spikes are the calibration lamp spectra (Hg+He).
We make a 1-D spectrum from the 2-D image by summing over the aperture of the slit covering M57. Using the well-characterized wavelengths of the calibration lamps, we can use IRAF to register our spectrum to provide a nice wavelength scale. Here's what our spectrum looks like once plotted as intensity versus wavelength.
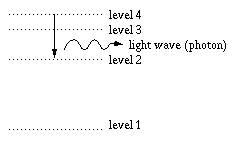
The emission line at 4861 Angstroms comes from hot, excited atomic hydrogen. Highly-excited hydrogen atoms in M57's gaseous shell, starting in energy level 4, may eventually de-excite to level 2, giving up the energy difference in waves of light at that particular energy (and... they have a wavelength of 4861 Angstroms!).
The brightest two lines at 4959 and 5007 Angstroms come from twice-ionized oxygen (labeled O++, or O III in spectroscopic notation). This means that two of oxygen's eight electrons have been ripped away. This is a also clue that conditions in this nebula must be harsh. In fact, these lines can only be excited to emit light in temperatures of several thousand Kelvins and rather thin densities of 1-100 atoms per cubic centimeter. There is no continuous spectrum here -- this points out the important fact that planetary nebulae are hot rarified gases -- you see a LINE spectrum. This also points out how astronomers can get valuable information about the physical conditions and important processes in distant astronomical objects.
This spectrum also demonstrates why you can use light-pollution filters (like those made by Lumicon or Orion) to get great contrast from reflection/emission nebulae! These filters pass light waves that lie at wavelengths covered by these three lines, but block light at all other wavelengths. For nebulae, this is very beneficial since they only emit visible light in this wavelength range. You can remove all that ugly skyglow and light pollution without reducing the brighness of the nebula you're looking for.
Would such a narrow-band filter be good for looking at stars or galaxies? Hmm?
Stellar Spectroscopy
A look at Sirius
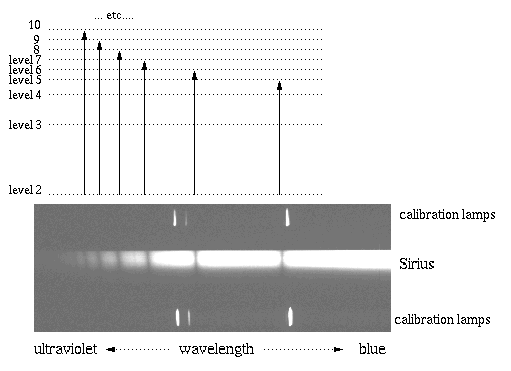
Now, onto stellar spectroscopy. This 1/2 second exposure of Sirius is centered near 4000 Angstroms (blue, near-ultraviolet) and clearly shows a series of deep absorption lines. These lines are due to the hydrogen atom. Let's explore how.
In the cooler outer "atmosphere" around Sirius, mildly excited hydrogen atoms in the 2nd energy level (the 1st excited state) are 'zapped' by photons (light waves) with just the right energy to send them to even higher excited states. In this figure, we match the dark absorption line that results from each transition upward in the hydrogen atom. Notice that the higher-energy transitions on the left result in higher energy absorption lines out in the ultraviolet. This series of lines, starting from level 2, is called the Balmer series after their discoverer.
Stars are classified by their temperatures, which can be determined by the star's spectral features. The hottest stars are termed O-stars, the next cooler are B stars, then A, F, G, K, and finally M-stars. Sirius is a relatively hot A-type star at about 10,000 degrees Kelvin. Such stars have the strongest hydrogen-features (simply due to temperature -- cooler stars can't 'zap' the hydrogen atoms as effectively, and hotter stars will destroy/ionize the hydrogen atoms that create the spectral lines!).
Molecules in Cool Stars!
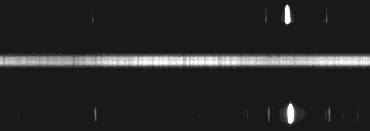
On the other end of the scale -- here is Delta Virgo; a cool M3-type giant star at about 3,500 K and viewed at about 6000 Angstroms (in red light). Note a bright continuum at far left, which suddenly dims into a series of striations (bands). These don't look like the sharp absorption lines of the hydrogen atom, do they? In fact, these bands are due to MOLECULES that can live in the atmospheres of these cool stars! This particular molecule is TiO (titanium oxide). Molecules have a dizzying number of lines because they not only have the electron energy levels like atoms, but also have energy sub-levels due to the rotation and vibration of the molecule! At the modest resolution of our spectrometer, these hundreds of lines are blended into absorption bands like what we see here.
Stars like our Sun
Somewhere between hotter A-type stars and cool M-class stars are stars like our sun, around 5500 degrees Kelvin. Here's Beta-Bootes, a G8 giant star (roughly what our sun will be when it begins dying in about 5 billion years). The first spectrum is at 5500 Angstroms (yellow light), just like the M-star spectrum above. Notice that molecules don't form here (it's too hot for molecules to readily form without being quickly destroyed), but there are still an awful lot of lines around. Most of these features are due to heavy elements -- things like carbon (in several ionization stages), iron, oxygen, magnesium, calcium etc.
This is a spectrum of the same star, but now taken at 4000 Angstroms (deep blue-violet light). The deep absorption lines at left are due to the ion Calcium II (the difference between this and normal, neutral calcium is that one electron has been stripped off here). The small dip in the middle is due to a blend of metallic features and hydrogen. Notice that the hydrogen lines are very weak here -- nothing at all like Sirius (a hotter A-class star).
Watch video:
Friday, January 10, 2014
The Four Laws Of Thermodynamics
The following are summaries of the four laws of thermodynamics. Notice that the last one is called the Third Law so the numbering starts with zero.
It is assumed that you know the definitions of the words used here
Zeroth Law of Thermodynamics:
There is a state function, called temperature which has the symbol T, which has the following relationship to heat, q :
addition of heat to a system will increase the temperature of the system.
if two closed system (together isolated), with different temperatures are brought into thermal contact, then the temperatures of the two systems will change to approach the same temperature. That is, the temperature of the system which is at a higher temperature will decrease and the temperature of the system with the lower temperature will increase. They will eventually have the same temperature.
The zeroth law leads to the general idea of heat capacity. The symbols Cp and C v are used for this (constant pressure and constant volume) but for solid there is usually little difference between these two. Using the relationship at constant volume (and therefore Cv ) between a change in temperature, Δ T , of a substance and the amount of heat transferred, q, to this substance is given by: q = Cv ΔT First Law of Thermodynamics
There is a state function, the internal energy E (in some texts U), which has the following properties:
in an isolated system E remains constant
addition of work, symbol w, to a closed system will increase the internal energy by the amount of work expended.
This can be express by the following relation ship for a change in internal energy and work, w, done on a closed system:
ΔE = q + w
Definition of enthalpy, H and ΔH
Use of internal energy or change in internal energy, Δ E , is not very convenient in chemistry. The reason for this is that when chemical reactions occur or samples are heated, the volume does not stay constant. If one is therefore interested in only q, the ΔE is complicated by an additional w. To avoid this a new quantity called enthalpy is defined, given the symbol H. H = E + PV or ΔH = ΔE + PΔV
Since at constant pressure PΔV = -- w if no other external form of work is present, then: ΔH = w + q + PΔ V
and ΔH = q
Therefore at constant pressure ΔH will yield the heat transferred. All thermodynamic tables use this as the tabulated "heat of reaction," etc. The Second Law of Thermodynamics:
The is a state function, entropy S, which has the following properties:
For a very small incremental addition of heat to a system, δq, one will obtain a very small increment of entropy, dS, according to the relationship: d S = δq/T , where T is the absolute temperature at the time and place of the heat transfer.
For an isolated system, any change over time in S is either positive or zero, that is: ΔS > or = 0
[Another way of saying this is to assume one can add heat to a system in such a way as to not change the temperature. (This might seem impossible but someone could be inside the system and balance the heat input with a chemical reaction that would take up the heat. Alternative system would be one in which a phase change, e.g.. ice to water, is taking place.) In such a system the change in entropy would be: Δ S = δΔq /T
For those who have calculus in your future, an increment of entropy designated by dS is related to a small increment of added heat, dq, by: dS = δq /T
where dS is now an exact differential, but δq is not. Thus 1/T is the integrating factor.]
If there is no net change in the state inside the isolated system then ΔS = 0. This then is the thermodynamic criterion for equilibrium .
Inside an isolated system, in order for a process to proceed, Δ S > 0. Such a process is said to be spontaneous. A process for which ΔS < 0 is called non-spontaneous and is impossible for an isolated system.
Mathematically one can derive the following conclusion for a closed system with movable boundaries to keep the internal pressure constant. To do this, a new state function is defined which combines the entropy with enthalpy. This is the Gibbs' free energy, G, defined by: ΔG = ΔH - T ΔS IMPORTANT EQUATION !!
For a closed system at constant pressure the condition for equilibrium is: ΔG = 0
For a closed system at constant pressure a process is spontaneous if: ΔG < 0
For a closed system at constant pressure a process is non spontaneous if: ΔG > 0
Summary of the criteria for equilibrium and spontaneity
Condition
For an Isolated System
For a Closed System at Constant Pressure
Spontaneous Process
ΔS > 0
ΔG < 0
Equilibrium
ΔS = 0
ΔG = 0
Non spontaneous Process
Impossible
ΔG > 0
The Third Law of Thermodynamics: As T → 0 K , S → 0.
For the General Chemistry student, the important point about the third law is that entropy is an absolute quantity which depends upon temperature. This is in contrast to ΔH for reactions which have as a reference the elemental state. Thus, when one looks up the ΔHof of an elements, the answer is 0. In contrast, So for an element (note difference in symbols as well) has a value for temperature above 0 K. Careful when doing calculations for ΔSo of reactions that you do not use 0 for the So of the elements.
The entropy change with respect to temperature can be thought of a continuous summation of all the increments of heat added to the system divided by the temperature at the time of the addition. Or symbolically: ΔS = (dq/T) dT which is approximately SUM of the ( Δq /T) s
Thus, to calculate a change in S one simply adds up the little increments of heat added divided by temperature.
The question then is, what if the addition of these increments start with the temperature at 0 K? The answer is, that at 0K the q added is also 0. 0 divided by 0 presents a dilemma and the third law answers this by the following: For a pure component in the most stable condition, S = 0 at T = 0 K.
This leads to the assumption needed above, that the So s for pure components are absolute values and are not referenced against some arbitrary initial condition like the ΔH o s are. As an illustration, see the example thermodynamic table and notice that the elements do have So s listed. Check out the following:
For the pure components (complete chemicals) the Sos are positive
For ions, which are not complete chemicals but only one leg of the ionic compound, there are ΔSo listed which can be either positive or negative. These ions are reference against the H+ (understood to stand for H3O+ ) ion.







 (dq/T) dT which is approximately SUM of the ( Δq /T) s